Online Digital ELISA Plate Reader & Standard Curve Calculator
In clinical and research laboratories, calculating ELISA (Enzyme-Linked Immunosorbent Assay) results manually can be time-consuming and prone to human error. Whether you are performing a quantitative sandwich ELISA or a qualitative screening test, accurate data transformation from Optical Density (OD) to concentration is critical.
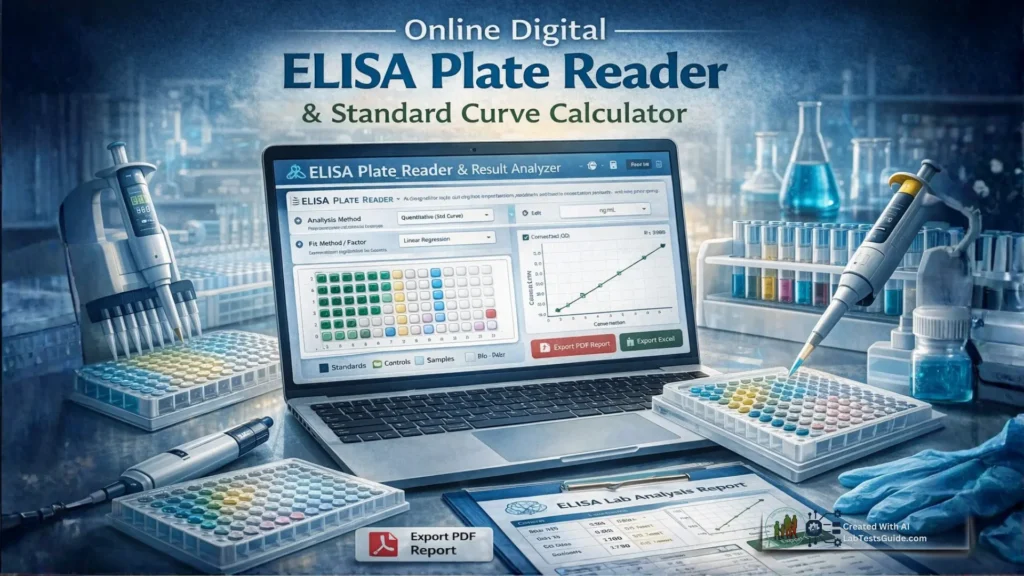
This Professional ELISA Plate Reader Tool is designed for lab technologists and students to streamline the analysis of 96-well plates. It supports linear regression for standard curves, qualitative cut-off logic, and professional PDF/Excel reporting.
How to Use the ELISA Calculator
- Step 1: Setup: Select your Analysis Type (Quantitative for concentration or Qualitative for Reactive/Non-Reactive status). Enter your measurement units (e.g., ng/mL).
- Step 2: Assign Wells: Click on the wells in the interactive 96-well plate map. Choose whether they are Standards, Controls, or Samples, then click “Apply.” The wells will change color for easy identification.
- Step 3: Data Entry: A table will appear below the plate. Enter the OD values obtained from your physical plate reader. For Standards, enter the known concentration values.
- Step 4: Calculate: Click “Calculate Results.” The tool will generate a linear regression curve and calculate the concentration of all unknown samples automatically.
- Step 5: Export: Download a professional PDF report containing the plate data, the standard curve graph, and the final results table, or export the data to Excel for further research.
🔬 ELISA Plate Reader & Result Analyzer
Technical Analysis & Troubleshooting
This tool uses Linear Regression Analysis to determine unknown concentrations. By plotting the known concentrations of standards (X-axis) against their measured absorbance (Y-axis), the tool calculates the best-fit line using the formula: y = mx + c.
Tips for Accurate ELISA Results
- Blank Subtraction: Always include a blank well (buffer only) to account for background noise. Subtract the blank OD from all other readings for higher precision.
- The Dynamic Range: Ensure your sample ODs fall within the range of your standards. If a sample OD is higher than your highest standard, the sample should be diluted and re-tested.
- R-Squared (R²): In a perfect linear regression, the R² value should be close to 1.0. If your curve looks scattered, check for pipetting errors or expired reagents.
- Coefficient of Variation (CV): For professional results, it is recommended to run samples in duplicate. A CV of less than 10% between duplicates is generally considered acceptable.
Educational Note for Students
Understanding the relationship between light absorbance and concentration is based on Beer-Lambert’s Law. As the concentration of the antigen in the well increases, the enzymatic color reaction becomes more intense, leading to a higher Optical Density (OD) reading from the spectrophotometer.
Disclaimer: This tool is intended for educational and research purposes only. Clinical diagnostic decisions should always be verified against laboratory protocols and manufacturer instructions for the specific ELISA kit used.